Information Studies Master’s students predict traffic density at public transport stations
24 March 2021

As part of the Data Systems Project (DSP), Master's students spend a semester working on an existing complex problem. They will design, implement and evaluate an interactive system in which the focus lies on delivering an interactive solution for a ‘big data’ problem.
Getting a grip on crowds
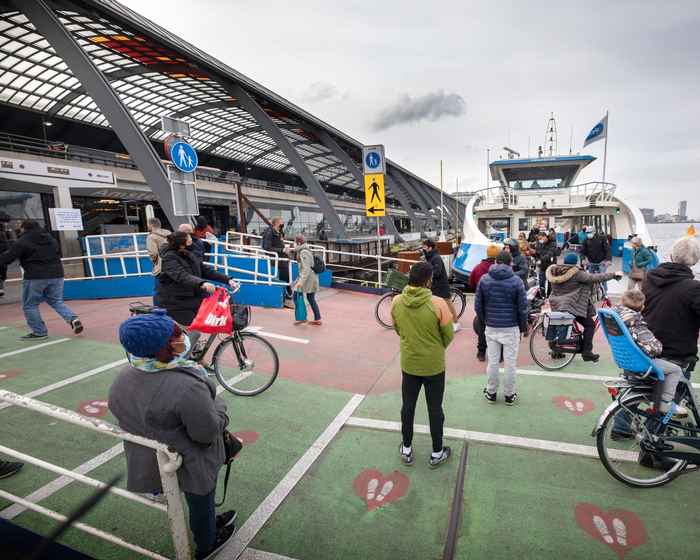
For the municipality of Amsterdam, it is extremely important to gain a good overview of where and when busy periods will occur. Boen Groothoff, Operational Mobility Center Project Manager of the municipality of Amsterdam: ‘Amsterdam has become increasingly crowded in recent years. These crowds, which are reflected in all modalities, are placing a strain on the public space. In addition to the classic problem of congested roads, masses of pedestrians lead to reduced ‘liveability’ in the city. In addition, the current COVID-19 pandemic can make crowded places a public health risk.’
Master’s students Rajeev Kalloe, Priya Jogie, Damian den Ouden, Priyanka Singh and Fajar Fathurrahman were commissioned by the municipality of Amsterdam to analyse the GVB data of the three busiest public transport stations in Amsterdam – Central Station, Station Zuid and Station Bijlmer ArenA – and investigate how they could use machine learning to make accurate predictions about traffic density.
‘Crowds’ during the coronavirus year
Through the municipality of Amsterdam, the students gained access to the GVB’s check-in and check-out data for the metro, bus and tram for 2020. ‘There were almost 12 months of data and 1.2 million observations: from the normal situation (January - 22 March) to full lockdown (23 March - 1 July), no lockdown (from July to 17 August) and partial lockdown (from 18 August to 13 December),’ explains student Rajeev Kalloe. ‘We combined the GVB data with KNMI data from the weather station at Schiphol and the public holidays in that period.’

Factors that normally influence crowds, such as the weather and events, became virtually irrelevant. The people who used public transport during the lockdown really needed it to get to work.Master's student Rajeev Kalloe
Kalloe: ‘Since the coronavirus measures entered into force, the traffic density has remained lower than normal. Crowds have decreased and this is still the case now. During the partial lockdown, the crowds halved compared to the normal situation and during the full lockdown, the crowds halved again compared to the partial lockdown. The largest decrease in passengers was seen at the VU stop, which was down 87%. At Central Station, there was a 75% drop in traffic density. The rush hours can still be identified, although the peak is much smaller than usual in the coronavirus period.’
Predicting crowds
Based on all the data, Kalloe and his fellow students trained various machine learning models. Random Forest Regression proved highly suitable for predicting busy periods in public transport stations. Kalloe: ‘With an accuracy of approximately 85% and an average error margin of 9%, we can now predict how busy it will be at Central Station, Station Zuid and Station Bijlmer ArenA.’
From March onwards, Rajeev Kalloe will be doing an internship at the municipality of Amsterdam for his Master's thesis. ‘I am going to map out the normal situation using GVB data from 2019 and combine it with exceptional situations (such as the coronavirus pandemic). This means that the municipality of Amsterdam will soon be able to make predictions about how busy it will be in various different situations.’